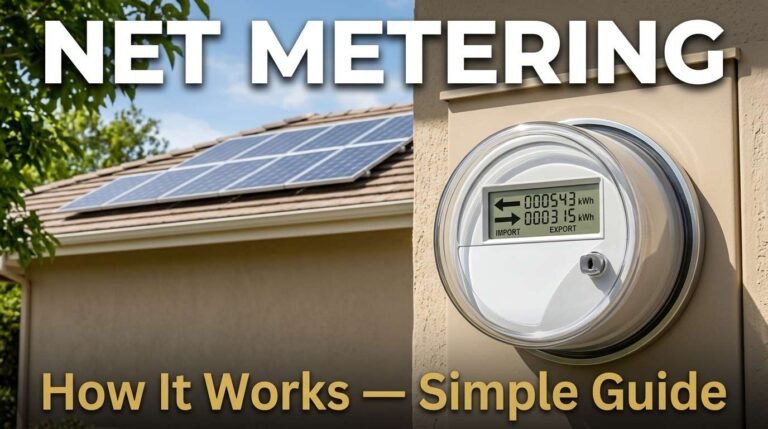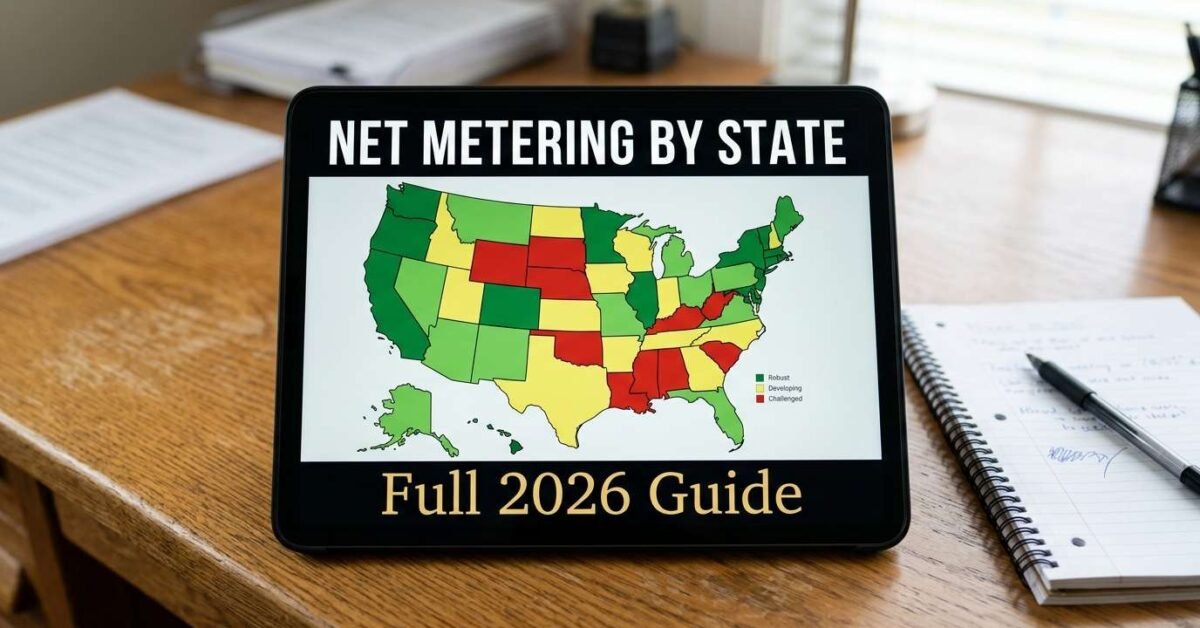
Net metering policies vary dramatically by state, and they directly determine how much money solar panels save you. States with full retail (1:1) net metering effectively let you use the grid as a free battery. States with reduced or no net metering make batteries financially necessary. Here is the current status by region as of 2026.
Net Metering by Region
| Region | States with Full Retail NM | States with Reduced NM | No Statewide NM |
|---|---|---|---|
| Northeast | NY, NJ, MA, CT, MD, PA, VT, NH, ME, RI | — | — |
| Southeast | NC, VA, FL (varies) | GA, SC | AL, TN, MS |
| Midwest | IL, MN, OH, WI, IA, MO | IN, MI | SD, ND |
| West | CO, NM, OR, WA, MT, NV | CA (NEM 3.0), AZ, UT | ID, WY |
| South | TX (varies by utility), LA, AR | OK | — |
Best States for Net Metering (2026)
New York offers full retail net metering with VDER (Value of Distributed Energy Resources) credits that can exceed the retail rate for some installations. Combined with state tax credits and the federal ITC, New York has one of the fastest solar payback periods in the country. New Jersey offers full retail plus SRECs (Solar Renewable Energy Certificates) worth $200 to $250 per MWh — effectively paying you a bonus on top of net metering. Massachusetts offers full retail plus SMART program payments — some installations achieve 3 to 4 year payback periods.
States Where Net Metering Changed Recently
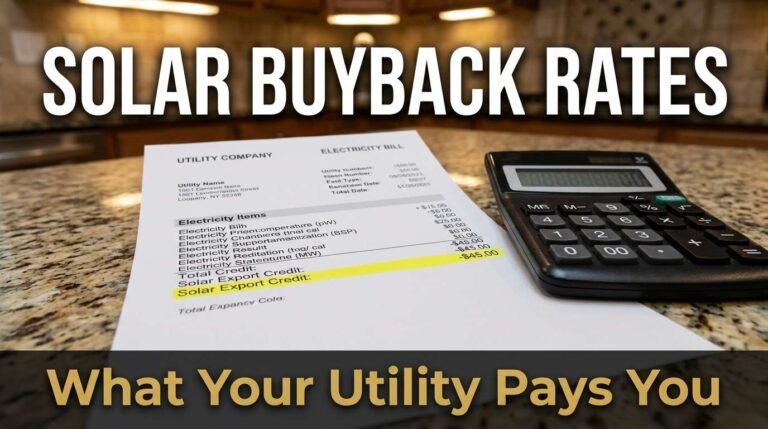
California (NEM 3.0, effective 2023): Reduced export credits from full retail (~$0.30/kWh) to time-varying rates averaging $0.05 to $0.08/kWh. Solar-only systems still save money but payback periods extended from 5 to 8 years. Adding a battery restores much of the savings by storing excess production for self-use during peak evening rates ($0.35 to $0.55/kWh). Nevada eliminated net metering in 2015, restored it in 2017 at reduced rates, and now offers about 75% of retail. Arizona transitioned from full retail to a reduced export rate in 2017; new installations receive roughly $0.09 to $0.11/kWh for exports.
What If Your State Has Weak Net Metering?
In states with reduced or no net metering, three strategies maximize solar value. First, maximize self-consumption by running high-energy appliances (dishwasher, laundry, EV charging) during peak solar production hours. Second, add battery storage to capture excess production for nighttime use instead of exporting at low rates. Third, size your system to match your daytime consumption rather than your total consumption — a smaller system with higher self-consumption often produces better ROI than a larger system that exports heavily at low rates.
Model the impact of your state’s net metering policy on your savings in our Net Metering Calculator — adjust the export rate to match your utility’s policy and compare with vs without battery storage. Then see the complete financial picture in our Solar Savings Calculator.
How to Check Your Utility’s Net Metering Policy
Every utility has different rules, even within the same state. Here is how to find your specific policy: (1) Visit your utility’s website and search for “net metering” or “solar buyback.” (2) Check the Database of State Incentives for Renewables and Efficiency (DSIRE) at dsireusa.org — it lists every state and utility’s solar policies. (3) Call your utility and ask: “What is your current net metering rate for new residential solar installations?” (4) Ask your solar installer — reputable installers know every local utility’s policies and can model your savings accurately. The rate you receive as a new customer may differ from rates grandfathered to earlier adopters, so always verify the current rate for new installations.
Net Metering Trends: What Is Changing
The trend across the US is toward reduced net metering rates. Utilities argue that solar customers shift grid maintenance costs to non-solar customers. Solar advocates argue that distributed solar reduces grid infrastructure costs and peak demand. The political reality: states are gradually moving from full retail to reduced rates, but the transition is slow (typically grandfathering existing customers for 15 to 25 years). For homeowners considering solar, the message is clear: install now to lock in the best available net metering rate before further reductions. Every year you wait risks a lower export rate. Our Solar Savings Calculator models scenarios at different export rates to show the long-term impact.
International Net Metering
Net metering exists globally under different names. Australia calls it “feed-in tariff” with rates of AUD $0.04 to $0.12/kWh depending on state and retailer. The UK’s Smart Export Guarantee (SEG) pays GBP £0.03 to £0.15/kWh. Germany’s feed-in tariff has declined from €0.50/kWh in 2004 to about €0.08/kWh in 2026. Pakistan has net metering in most provinces with rates close to full retail. India’s net metering policies vary by state, with most offering 1:1 credits. In all markets, the same principle applies: the higher the export rate, the better the solar ROI, and the less financial incentive there is to add battery storage.