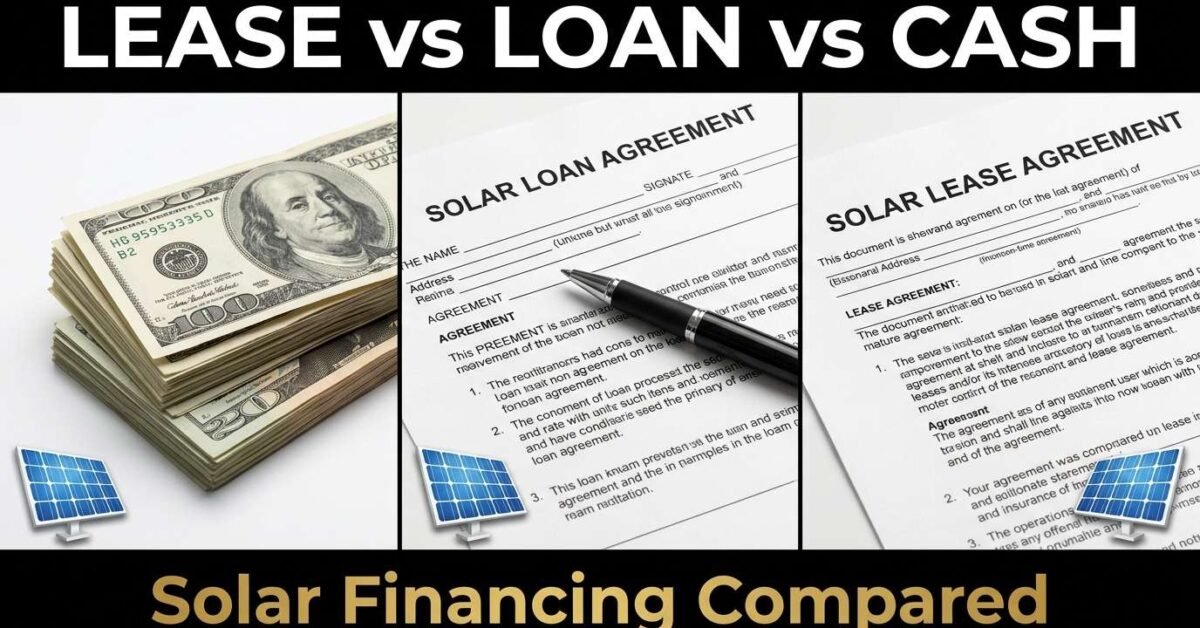
There are three ways to pay for solar panels: cash purchase, solar loan, and lease or power purchase agreement (PPA). Cash purchase delivers the highest 25-year return because you avoid interest charges and claim the full 30 percent tax credit. Solar loans offer zero down payment with ownership benefits. Leases and PPAs require zero investment but deliver the lowest total savings. Here is how each option compares.
Cash vs Loan vs Lease: Side-by-Side
| Factor | Cash Purchase | Solar Loan | Lease / PPA |
|---|---|---|---|
| Upfront cost | $14,000-18,000 (after ITC) | $0 down | $0 down |
| Monthly payment | None | $100-200/mo (7-20 yr) | $80-150/mo (20-25 yr) |
| Tax credit (30%) | You claim it | You claim it | Leasing company claims it |
| System ownership | You own it | You own it | Company owns it |
| 25-year savings | $50,000-80,000 | $30,000-55,000 | $15,000-25,000 |
| Home value increase | Yes (~4%) | Yes (~4%) | No (complicates sale) |
| Maintenance | Your responsibility | Your responsibility | Company handles it |
| Best for | Maximum ROI | No upfront capital | Zero risk, zero hassle |
Cash Purchase: Maximum Return
Paying cash eliminates interest charges and lets you claim the full 30 percent federal tax credit yourself. The payback period is 5 to 8 years, after which every kilowatt-hour of solar production is pure savings. Over 25 years, a cash purchase typically saves $50,000 to $80,000 depending on electricity rates and system size. The downside: you need $14,000 to $18,000 (after ITC) upfront. If you have the capital and plan to stay in the home, cash purchase is always the financially optimal choice.
Solar Loan: Ownership Without the Upfront Cost
Solar loans let you own the system with zero down payment. You claim the tax credit (which can be applied toward early loan principal) and build equity in the system from day one. Most solar loans have terms of 10 to 20 years at 4 to 8 percent APR. The monthly loan payment is often similar to or less than your previous electricity bill, meaning you are cash-flow neutral or positive from month one. Total 25-year savings are lower than cash due to interest, but you preserve your capital for other investments.
Lease / PPA: Zero Risk, Lower Reward
A solar lease or PPA requires zero investment — the solar company installs, owns, and maintains the system on your roof. You pay a fixed monthly rate (lease) or a per-kWh rate (PPA) that is lower than your utility rate. The savings are real but modest — typically 10 to 20 percent off your electricity bill. The solar company claims the tax credit and depreciation benefits, which is why they can offer zero-down terms. The drawback: you do not own the system, the contract typically lasts 20 to 25 years, and selling your home requires the buyer to assume the lease — which can complicate the sale.
Compare your total costs for any financing option in our Installation Cost Calculator and see the payback timeline in the Solar Savings Calculator.
State and Local Incentives
Beyond the federal ITC, many states offer additional rebates and tax credits. New York offers up to $5,000 in state credits. Massachusetts has SMART program payments. Some utilities offer $500-2,500 rebates. Check DSIRE (dsireusa.org) for your state. Our Installation Cost Calculator applies all incentives automatically.
Getting Multiple Quotes
Always get 3+ installer quotes. Prices vary 20-40% between companies for the same system. Compare on cost-per-watt (total price ÷ system watts) with matching equipment specs. Our installation cost guide shows fair pricing by state.
Energy Cost Impact
Monthly cost formula: (Watts × hours per day × 30) ÷ 1,000 × electricity rate. At the US average of $0.16/kWh, a 1,500W appliance running 2 hours daily costs $14.40/month. A 100W device running 8 hours costs $3.84/month. Even small wattage reductions compound over a year — saving 50W over 8 daily hours saves $23 annually. Calculate all your appliances combined in our Electricity Bill Calculator.
Measuring Your Actual Consumption
Published wattage ranges are approximations. Your specific model may draw more or less depending on age, settings, and condition. For exact numbers, use a plug-in watt meter (Kill A Watt P4400 or Poniie PN2000, both under $25) between the appliance and the wall for 24 hours. The meter captures running watts, peak surge, and total kWh consumed — the precise values for sizing solar panels, batteries, or generators. Look up typical values first in our Appliance Wattage Database with 140+ devices.
Sizing Solar Panels and Battery Backup
Use the average wattage for energy calculations (how many panels you need) and the startup surge for inverter and generator sizing (how big the inverter must be to handle the peak). Our Solar System Calculator handles both — enter all your appliances and get the complete system specification. For battery backup runtime, use our Battery Backup Calculator. For generator sizing, use our Generator Sizing Calculator which accounts for motor startup surge automatically.
Reducing Energy Consumption
The cheapest watt is the one you never use. Before sizing a solar system or generator, consider whether you can reduce consumption first. Upgrading to Energy Star rated appliances typically reduces consumption by 20 to 50 percent. Using timers and smart plugs eliminates standby power draw (which accounts for 5 to 10 percent of total home electricity use). Switching from incandescent or halogen to LED lighting reduces lighting consumption by 75 percent. Every watt you eliminate from your load reduces the solar panel count, battery size, and inverter capacity — saving thousands of dollars on the system.