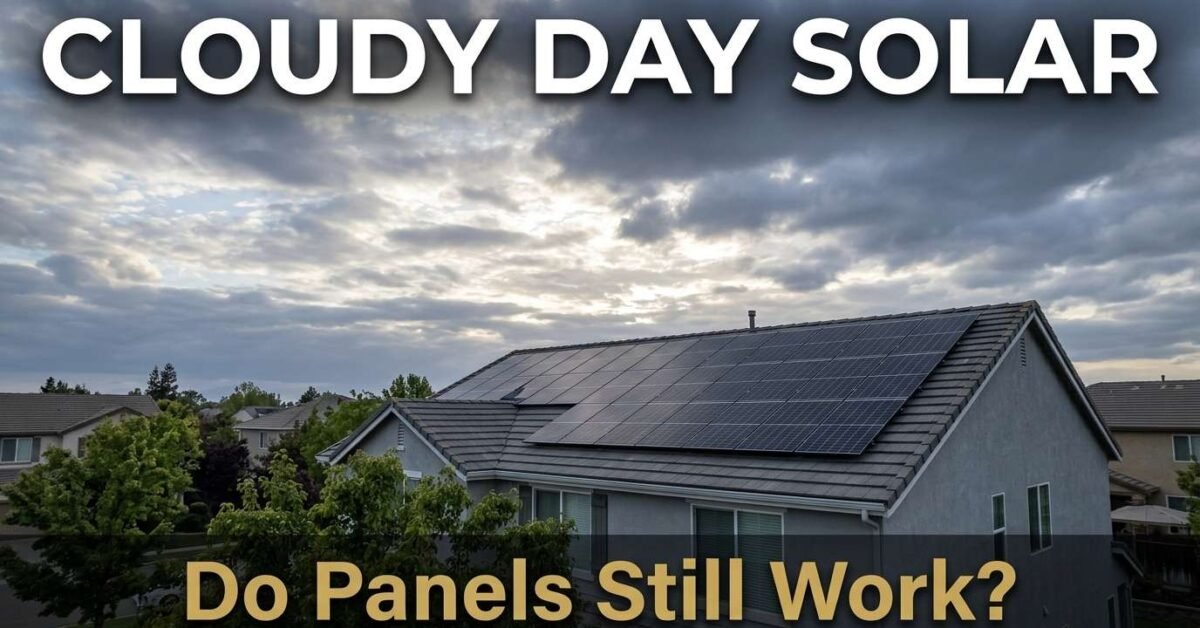
Yes, solar panels work on cloudy days — but at reduced output. On a heavily overcast day, panels produce 10 to 25 percent of their rated capacity. On a partly cloudy day, they produce 50 to 70 percent. On a bright cloudy day with thin cloud cover, output can reach 80 percent. Solar panels respond to light, not direct sunlight — diffuse light that passes through clouds still generates electricity, just less of it.
Solar Output by Weather Condition
| Weather | Panel Output | 400W Panel Produces |
|---|---|---|
| Clear sunny day | 90-100% | 360-400W |
| Bright cloudy (thin clouds) | 60-80% | 240-320W |
| Partly cloudy | 50-70% | 200-280W |
| Overcast | 10-25% | 40-100W |
| Heavy rain/storm | 5-15% | 20-60W |
| Snow-covered panels | 0-5% | 0-20W |
The key insight: solar system sizing uses “peak sun hours” which already account for average cloud cover at your location. A location with 5 peak sun hours does not have 5 hours of sunshine — it has the equivalent of 5 hours of full-intensity sun averaged across all weather conditions throughout the year. Our Panel Output Calculator uses peak sun hours to give you realistic annual production estimates.
How Cloudy Climates Still Work for Solar
Germany, the UK, and the Pacific Northwest all have thriving solar industries despite being significantly cloudier than Arizona or California. The economics work because: electricity rates are high (making every kWh of self-produced solar valuable), modern panels are much more efficient at capturing diffuse light than older models, and system sizing accounts for the reduced production. A 10 kW system in Seattle produces about 11,000 kWh per year versus 16,000 kWh in Phoenix — 30 percent less, but still enough to offset a significant portion of a home’s electricity consumption. The longer payback period (7 to 10 years versus 5 to 7 years) is offset by higher electricity rates in cloudy regions.
Size your system for your specific climate in our Solar System Calculator and calculate the financial return in the Savings Calculator.
Real-World vs Laboratory Performance
Solar panel specifications are measured under Standard Test Conditions (STC): 25 degrees Celsius cell temperature, 1,000 W/m2 irradiance, and AM 1.5 spectrum. In real-world conditions, panels rarely achieve STC performance because cell temperature exceeds 25 degrees (every degree above STC reduces output by 0.3 to 0.4 percent), irradiance varies throughout the day, and atmospheric conditions differ from the laboratory standard. Expect real-world output to be 80 to 85 percent of the STC rating — this is already factored into our calculators through the system derating factor.
Maintenance and Cleaning
Solar panels require minimal maintenance. Rain cleans most dust and debris naturally. In dry, dusty regions, washing panels with water once or twice a year recovers 2 to 5 percent of lost output. Do not use pressure washers, abrasive cleaners, or soap — these can damage the anti-reflective coating. A garden hose from the ground is sufficient for most installations. Annual visual inspection of the racking, wiring, and connections catches loose bolts and corroded terminals before they become problems.
Model your system’s performance over time in our Panel Degradation Calculator and calculate the financial impact of panel choices in the Solar Savings Calculator.
Energy Cost Impact
Monthly cost formula: (Watts × hours per day × 30) ÷ 1,000 × electricity rate. At the US average of $0.16/kWh, a 1,500W appliance running 2 hours daily costs $14.40/month. A 100W device running 8 hours costs $3.84/month. Even small wattage reductions compound over a year — saving 50W over 8 daily hours saves $23 annually. Calculate all your appliances combined in our Electricity Bill Calculator.
Measuring Your Actual Consumption
Published wattage ranges are approximations. Your specific model may draw more or less depending on age, settings, and condition. For exact numbers, use a plug-in watt meter (Kill A Watt P4400 or Poniie PN2000, both under $25) between the appliance and the wall for 24 hours. The meter captures running watts, peak surge, and total kWh consumed — the precise values for sizing solar panels, batteries, or generators. Look up typical values first in our Appliance Wattage Database with 140+ devices.
Sizing Solar Panels and Battery Backup
Use the average wattage for energy calculations (how many panels you need) and the startup surge for inverter and generator sizing (how big the inverter must be to handle the peak). Our Solar System Calculator handles both — enter all your appliances and get the complete system specification. For battery backup runtime, use our Battery Backup Calculator. For generator sizing, use our Generator Sizing Calculator which accounts for motor startup surge automatically.
Reducing Energy Consumption
The cheapest watt is the one you never use. Before sizing a solar system or generator, consider whether you can reduce consumption first. Upgrading to Energy Star rated appliances typically reduces consumption by 20 to 50 percent. Using timers and smart plugs eliminates standby power draw (which accounts for 5 to 10 percent of total home electricity use). Switching from incandescent or halogen to LED lighting reduces lighting consumption by 75 percent. Every watt you eliminate from your load reduces the solar panel count, battery size, and inverter capacity — saving thousands of dollars on the system.