Every solar buyer asks the same question: when does solar break even against my electricity bill? The answer is not just a number of years — it is a moving target that gets better every year as electricity rates rise and your solar system keeps producing for free. This guide explains the break-even dynamics and shows you how to find your exact crossover month.
The Break-Even Concept
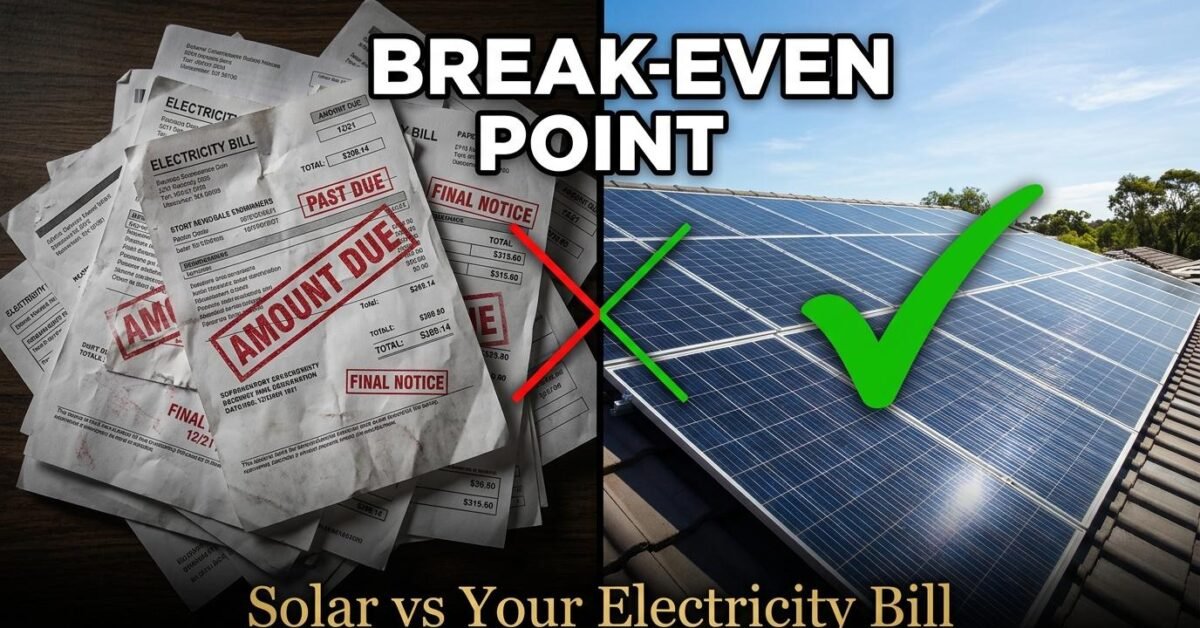
Break-even is the month when your cumulative electricity savings from solar equal the net cost of your system. Before that month, you are “in the red” — you have spent more on the system than you have saved. After that month, you are “in the green” — every additional saving is pure profit. The break-even point is also called the payback period, and it is the single most watched metric in solar financial analysis.
For most US homeowners in 2026, break-even occurs between month 48 and month 96 (4 to 8 years), depending on electricity rate, system cost, and incentives. After break-even, the system produces free electricity for another 17 to 21 years of its warranted life.
Why Rising Electricity Rates Accelerate Break-Even
This is the insight most simple calculators miss. If your electricity rate stays flat at 0.15 dollars per kWh, your annual savings stay flat at 1,800 dollars for a system offsetting 1,000 kWh per month. But rates do not stay flat — they rise 3 to 8 percent per year. At 5 percent annual increase, your year-one savings of 1,800 dollars become 2,330 dollars by year 5, 2,931 dollars by year 10, and 6,100 dollars by year 25. The cumulative effect is dramatic: flat-rate assumptions show break-even at year 5, but with rate inflation, break-even often occurs 6 to 12 months earlier because each year’s savings are higher than the last.
Solar vs Grid: The Long-Term Picture
Without solar, your electricity costs compound year after year with no end. A 150-dollar monthly bill at 5 percent annual increase costs you 1,800 dollars in year one, 2,330 dollars in year five, 2,931 dollars in year ten, and 6,100 dollars in year 25. Over 25 years, you pay about 86,000 dollars in electricity — and you own nothing at the end. With solar, you pay 8,400 dollars once (after the ITC) and generate that same 86,000 dollars worth of electricity for free. The 25-year net difference is roughly 77,000 dollars in your favor.
Framing it differently: without solar, your electricity cost over 25 years is 86,000 dollars. With solar, it is 8,400 dollars. Solar reduces your quarter-century electricity cost by over 90 percent.
What Delays Break-Even
Low electricity rates extend break-even because each kWh of solar production saves less money. High system costs without offsetting incentives push break-even later. Partial offset (solar covering only 60 to 70 percent of your bill) means you still pay a monthly utility bill, reducing net savings. And systems in low-sun regions produce less per panel, requiring more panels to achieve the same offset — increasing cost without proportionally increasing savings.
The Compounding Cost of Doing Nothing
The most overlooked aspect of the solar decision is the cost of waiting. Every year you delay going solar, you pay another year of rising electricity costs — money that is gone forever with nothing to show for it. If your current bill is 150 dollars per month and rates rise 5 percent annually, waiting 3 years costs you roughly 5,700 dollars in electricity payments that solar would have avoided. Waiting 5 years costs about 9,900 dollars. And system costs are not dropping fast enough to offset these losses — panel prices have largely stabilized, and installer labor costs are rising.
The financial case for solar is strongest when you install as early as possible, because every month of delay is a month of paying rates that only go up. The system you install today starts saving money tomorrow and keeps saving for 25 years. The system you install next year starts one year later — and that year of electricity payments is a sunk cost you never recover.
Solar Plus Rate Arbitrage
In markets with time-of-use electricity pricing, solar creates an additional savings opportunity called rate arbitrage. Time-of-use rates charge more during peak hours (typically 4 PM to 9 PM) and less during off-peak hours. Solar panels produce most of their energy during midday — which is off-peak in many TOU schedules. With battery storage, you can store cheap midday solar production and use it during expensive peak hours, effectively buying electricity at zero cost and avoiding the highest-rate periods. This arbitrage can increase your effective savings by 20 to 35 percent compared to a flat-rate calculation.
Find Your Break-Even Month
Our Solar Savings Calculator shows your exact break-even month with rate inflation modeled year by year. The expandable year-by-year table shows your net position each year — red when you are still recouping the investment, green when you have crossed into profit. Enter your real numbers and see exactly when solar becomes cheaper than your electricity bill.